
The RightMessage Debugger is a powerful testing tool that lets you preview how different visitor segments experience your website personalization. To activate the debugger, simply add ?debug=true to any URL where RightMessage is installed.
Overview
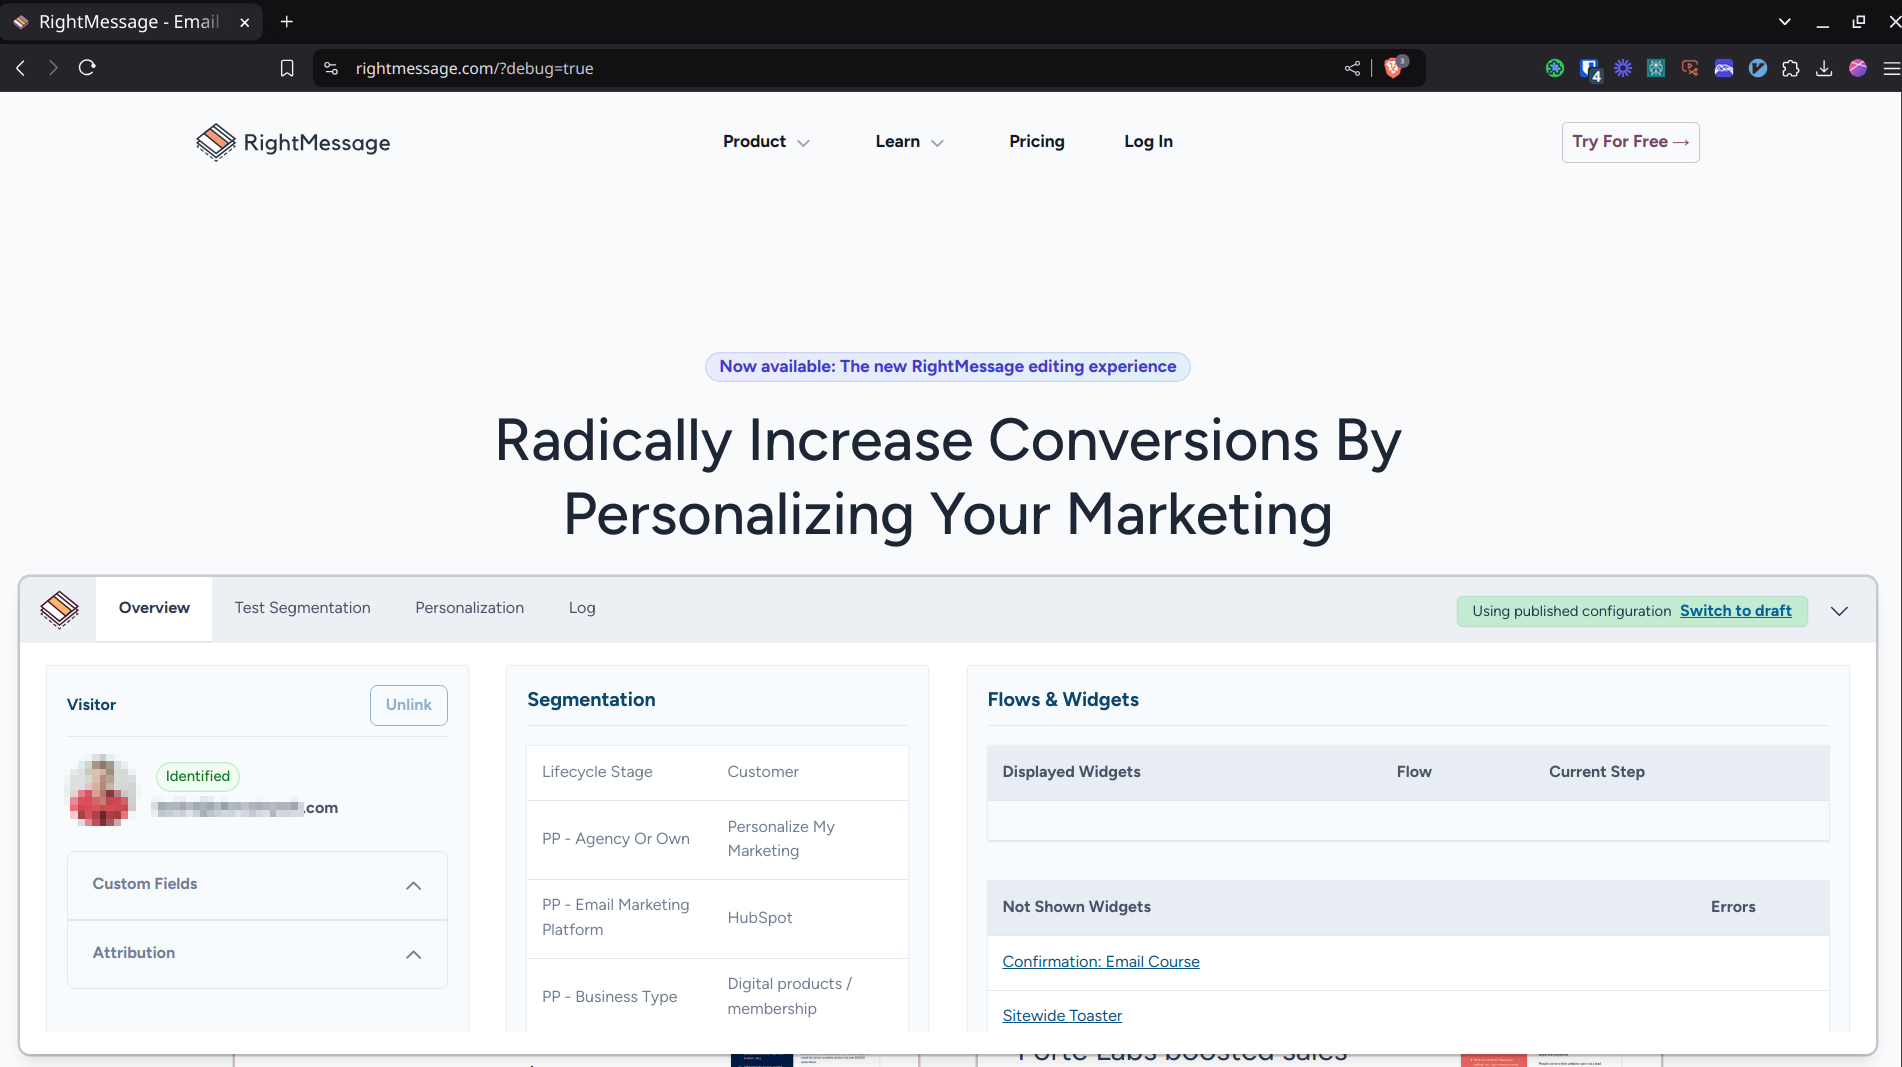
When activated, the debugger appears as an overlay panel at the bottom of your page with four key sections:
Overview: General visitor information and current status
Test Segmentation: Preview different segment combinations
Personalization: View active personalization campaigns and their effects
Log: Track technical details and widget activity
Note:
Only you can see the debugger interface. Your regular site visitors won't see any debugging information or tools.
Main Features
Test Segmentation
The Test Segmentation panel allows you to simulate different visitor segments and instantly see how your website responds. Here's how it works:
Select from your configured segments using the dropdown menus (e.g., "Business Type," "Email Platform," "Lifecycle Stage")
Mix and match different segment combinations to test complex personalization scenarios
Watch as your website content, elements, and messaging update in real-time to match what that specific segment would see
Pro Tip
Use this feature to QA your personalization rules before publishing them to live visitors. It's especially useful for testing segment intersections and ensuring your content changes appear correctly.
Personalization Inspector
The Personalization panel provides a detailed view of all active personalizations on your page, displayed in an easy-to-read table format with four key columns:
Campaign: Shows the name of each active personalization campaign
Selector: Displays the CSS selector being targeted (e.g.,
.logos-default,.header-text)Affected Elements: Indicates how many elements are being modified
Modifications: Lists all changes being applied, including:
Text changes
Style modifications
Class adjustments
Visibility settings
This transparency helps you verify that your personalizations are working as intended and troubleshoot any unexpected behavior.
Debug Log
The Log panel provides real-time technical insights into RightMessage's operation on your page. It includes:
Status Messages
Script loading confirmation
Widget mounting notifications
Important system messages
Filter Options
Use the "Filter by type" dropdown to focus on specific message types
Messages are timestamped for easy reference
Technical Details
Widget configuration data
JSON output for advanced debugging
Integration status updates
Note:
The log confirms that "Only YOU can see the debugger" for peace of mind when testing in production environments.
This logging system is particularly valuable when:
Troubleshooting widget placement
Verifying script installation
Checking personalization timing and execution
Best Practices
Testing Workflow
Start with individual segments before testing combinations
Document unexpected behaviors or content changes
Test all critical user paths with different segment combinations
Troubleshooting Tips
Use the Log panel to verify script loading
Check the Personalization tab to confirm selector accuracy
Test on different devices and browsers for consistency
Performance Monitoring
Watch for any loading delays
Monitor widget mounting success
Verify personalization changes happen smoothly